Create your first data visualization chart in VueJS with D3! started with this one
looks like ineresting reading: Vue.js and D3: A Chart Waiting To Happen This article is the summary of a talk I gave at the Vue.js Antwerp meetup.
5 simple rules to data visualization with Vue.js and D3.js This is your last free member-only story this month.
that one doesn't use any vue additions, it just:
import * as d3 from 'd3';
descr starts with svg as html: Using .enter and .append
SO description with ul and li: [d3 selectAll selectAll append append])https://stackoverflow.com/questions/25455486/d3-selectall-selectall-append-append)
Note that it's important to use select() for the ul and selectAll() for the li. The former sets up the parent context, the latter prepares it to be bound to the data. The typical d3 sequence of selectAll-then-bind-then-append works on one level only.
do not use: d3vue
d3-force seems like single-function/chart
Hmm.., wait: neither Tracey nor xx use i/f libraries...
[dc.js(dc.js - Dimensional Charting Javascript Library) - Dimensional Charting Javascript Library](dc.js - Dimensional Charting Javascript Library
Crossfilter - Fast Multidimensional Filtering for Coordinated Views
import * as d3 from "d3";page that led to Tracey's: D3
then: Data visualization examples using Vue.js and D3.js
uses vue: Visualize Data with a d3.js Bar Chart
Vue.component('d3-bar-chart', {
d3 only, no vue: Create Bar Chart using D3
not vue: D3.js Tutorial: Building Interactive Bar Charts with JavaScript
How to make a bar chart using Vue.js am following this one, but:
npm install d3-scale
Yipee! a bar chart FINALLY shoows up!
BUT it was really hard to do the scale bars, ticks, etc.
GOING back to libraries...
next to try: vue-d3 - Vue Wrapper for D3.js
CLAIMS it does stacked bar charts
npm i --save d3 @voicehub/vue-d3
seems to be one guy that wrote a wrapper...
Reusable Charting Library – vue-d3-charts https://github.com/Saigesp/vue-d3-charts ???
never worked: https://github.com/emiliorizzo/vue-d3-barchart
https://developer.aliyun.com/mirror/npm/package/vue-d3-barchart/v/0.0.10
The Big List of D3.js Examples
INSERT pd print here
the input Pandas DataFrame:
>>> print(chart_df)
      index              arr_qh corner  b4_dep_dist  b4_ent_dist     flw_dist
0         0 2020-01-01 08:00:00     nw   146.631121   146.631121   146.992538
1         1 2020-01-01 10:45:00     nw   202.864895   202.402348   181.777948
2         2 2020-01-01 11:00:00     sw   333.050641   333.050641   331.106176
3         3 2020-01-01 11:15:00     sw   333.132258   334.008091   333.618287
convert to json string (a text string of the json components), then to json structure:
    xxx_jsn = xxx_df.to_json(date_format='iso', orient="split",
                                 default_handler=str)
    xxx_dct = json.loads(xxx_jsn)
Note: pd.to_json outputs a single string, but we will be combining it with
other items into larger jso struct, so need it to be a json object rather than
a json-looking string
Note: orient="records" makes output the full-text assoc. array, with names for each element.
Note: orient="split" is much smaller than orient="records", but is a plain list,
and then inside javascript will need to be converted to assoc. array for typical use.
pd.to_json(orient="split") followed by json.loads() gives us:
{
  "columns": [ "index", "arr_qh", "corner", "b4_dep_dist", "b4_ent_dist", "flw_dist" ],
  "data": [
      [ 0, "2020-03-02T08:00:00.000Z", "ne", 227.3, 227.3, 228.0 ],
      [ 1, "2020-03-02T08:00:00.000Z", "se", 199.2, 199.2, 212.2 ],
      [ 2, "2020-03-02T08:15:00.000Z", "sw", 262.8, 262.8, 253.3 ],
      [ 3, "2020-03-02T08:45:00.000Z", "nw", 146.2, 146.2, 145.5 ],
      [ 4, "2020-03-02T08:45:00.000Z", "sw", 375.1, 375.1, 373.6 ]
    ]
}
    this.cadata = [];
    for(var k = 0; k < chart_args.cdata.data.length; k++) {
        var item = { 'arr_qh'      : chart_args.cdata.data[k][1].substr(0,16),
                     'corner'      : chart_args.cdata.data[k][2],
                     'b4_dep_dist' : chart_args.cdata.data[k][3],
                     'b4_ent_dist' : chart_args.cdata.data[k][4],
                     'flw_dist'    : chart_args.cdata.data[k][5] };
        this.cadata.push(item);
    }
Javascript associative array as input to d3 routines:
Array(275):
[
  { arr_qh: "2020-03-02T08:00", b4_dep_dist: 227.3, b4_ent_dist: 227.3, corner: "ne", flw_dist: 228.0 },
  { arr_qh: "2020-03-02T08:00", b4_dep_dist: 199.2, b4_ent_dist: 199.2, corner: "se", flw_dist: 212.2 },
  { arr_qh: "2020-03-02T08:15", b4_dep_dist: 262.8, b4_ent_dist: 262.8, corner: "sw", flw_dist: 253.3 },
]
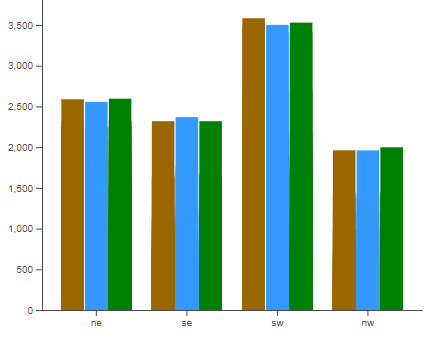
// List of groups = species here = value of the first column called group
var wt_groups = [ "ne", "se", "sw", "nw" ];

  // ---- Add X axis
  let x = d3.scaleBand()
      .domain(wt_groups)
      .range([0, width])
      .padding([0.2])
  svg.append("g")
    .attr("transform", "translate(0," + height + ")")
    .call(d3.axisBottom(x).tickSizeOuter(0));

  // ---- Show the bars
  svg.append("g")
    .selectAll("g")
    .data(ndata)
    .enter()
    .append("g")
      .attr("transform", function(d) { return "translate(" + x(d.corner) + ",0)"; })
btw, use one of these to copy file to opal:
    > scp bar_chart.png  wendell@carrotseverywhere.com:notes_source/cssi/
    > scp bar_chart.png  wendell@carrotseverywhere.com:apps/notes_static/cssi/
TODO: make get_chart_from_details in get_feb.py
(similar to everything.py's form_flown_at_entry_data() )